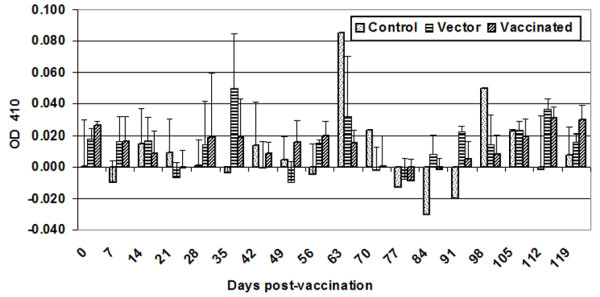
Figure 4.

Serum IgA antibody response. Peripheral blood was collected weekly from all calves during the length of the vaccination study. Intimin-specific serum IgA antibody concentrations were measured by ELISA. The bar graph depicts the mean (± standard deviation) of animals in each group. Normalization of data was performed by subtracting the OD410 of diluent-only wells from experimental values.
