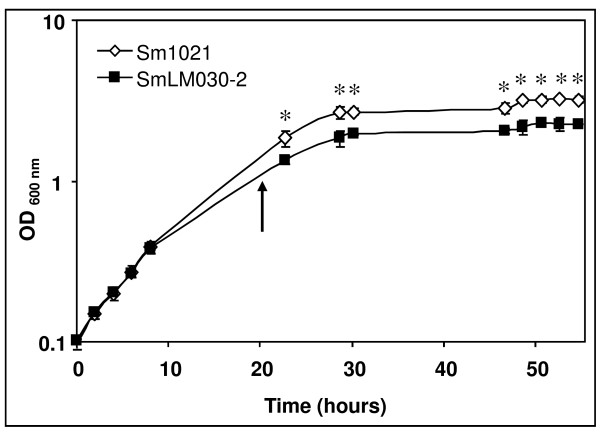
Figure 1.
Effect of tolC mutation on growth of S. meliloti 1021. Growth curves of S. meliloti 1021 (◊) and SmLM030-2 tolC mutant (■) were obtained in GMS medium. Optical density values are the means of three independent experiments. The arrow indicates the time point where cells were collected for total RNA extraction. Error bars show standard deviations. Asterisks represent data points with significantly different means (p-value < 0.01).

