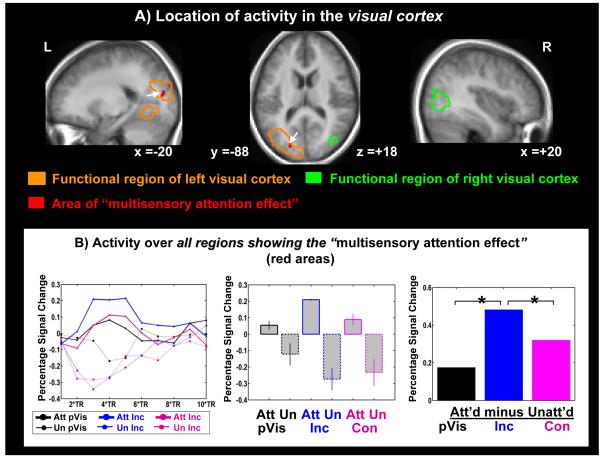
Figure 3. Effects in visual cortex.
Top panel (A): Areas of ‘conflict-induced attentional boosting’ collapsed over congruent and incongruent trials in the functionally defined regions of visual cortex (red areas in green/orange outlines). Activations are overlaid on the mean anatomical image of all 16 subjects. White arrows note the location of the significant multisensory attentional effects. This ‘multisensory attention effect’ region was found to be significant at a corrected threshold of p = 0.05. Bottom panel (B): The time course of activity over all areas of multisensory attentional enhancement in visual cortex (red area in Fig. 3A; left panel) and the resulting bar plots of activity changes in this area, shown separately for the attended-visual and unattended-visual conditions for the different stimulus types (central panel), along with the corresponding attentional difference effect. Attention-related differences and thresholds were calculated as in Fig. 2.

