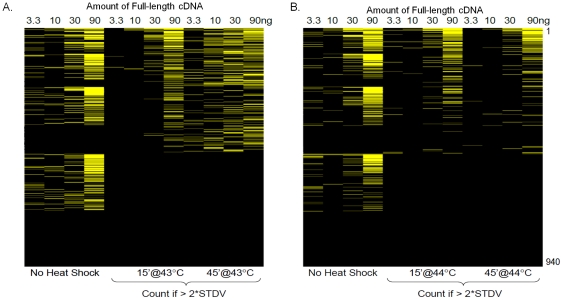
Figure 2. A heat map showing the results from the secondary screen for hyper-activation of the heat shock response.
An active subset of full-length genes from the primary screen was transfected at multiple concentrations and subjected to two different heat shock temperatures, (A) 43°C and (B) 44°C. The degree of hyper-activation of the response is represented by the intensity of the yellow color. A positive hit is scored if the full-length gene activates the normalized HSP70B reporter by more than two standard deviations above the mean of the negative control (pCMV-Sport6 Empty). The response curve under non-heat shock conditions was monitored but not included in the calculation of the score.

