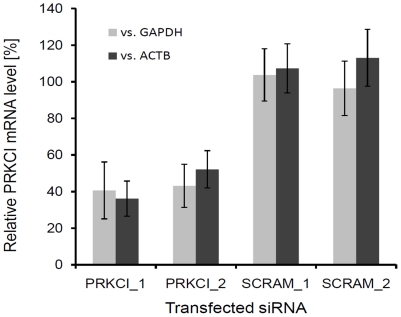
Figure 3. Quantitative RT-PCR verification of PRKCI knockdown by the siRNA duplexes.
The bars represent the mean and standard deviations from two independent experiments. PRKCI_1, siRNA duplex #1 targeting PRKCI; PRKCI_2, siRNA duplex #2 targeting PRKCI; SCRAM_1, scrambled siRNA duplex #1; SCRAM_2, scrambled siRNA duplex #2. The light bars represent normalization to GAPDH and the dark bars represent normalization to ACTB.

