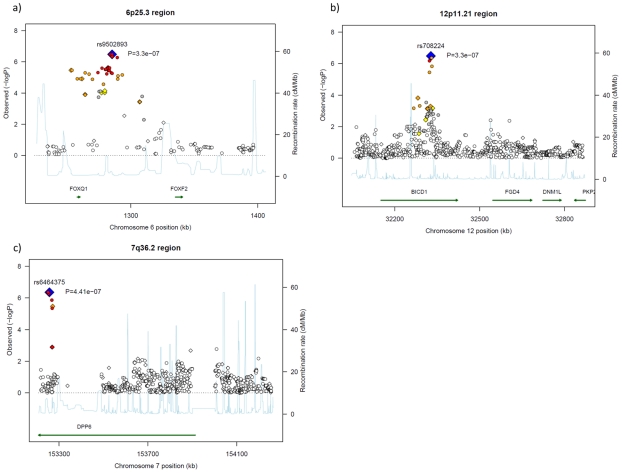
Figure 3. Regional association plots for three pancreatic cancer risk loci.
(a) 6p25.3 region, SNP rs9502893 located 25 kb upstream to gene FOXQ1. (b) 12p11.21 region, SNP rs708224 is located at the second intron of gene BICD1. (c) 7q36.2 region, SNP rs6464375 is located at the first intron of gene DPP6 transcript variant 3. Each of the marker SNPs is marked by a blue diamond. SNPs that are genotyped in the Illumina platform are plotted as diamonds; Imputed SNPs are plotted as circles. The color intensity reflects the extent of LD with the marker SNP, red (r2≥0.8), orange (0.5≤r2<0.8), yellow (0.2≤r2<0.5) and white (r2<0.2). Light blue line indicated local recombination rate.

