Fig. 6.
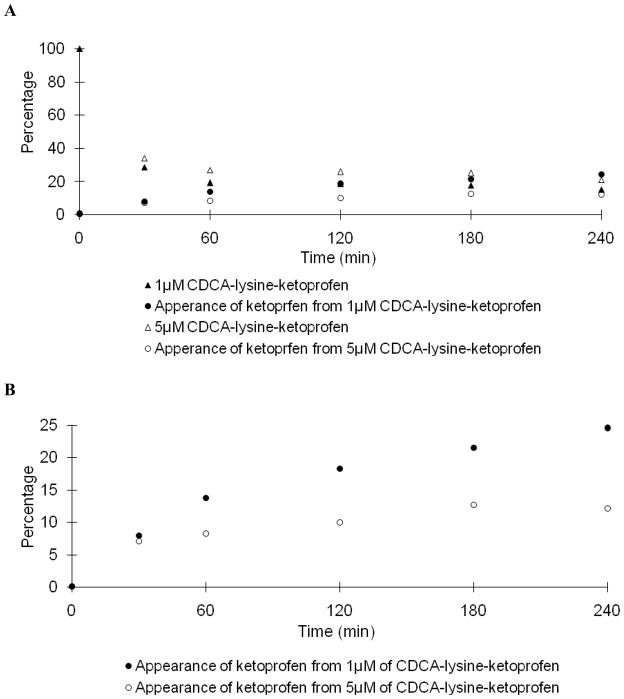
Hydrolysis of potential prodrug CDCA-lysine-ketoprofen in rat liver homogenate. In panel A, data points indicate the time course of the disappearance of 1 μM (▲) and 5 μM (△) of CDCA-lysine-ketoprofen and the appearance ketoprofen from 1 μM (●) and 5 μM (○) CDCA-lysine-ketoprofen. In panel B, ketoprofen appearance from of 1 μM (●) and 5 μM (○) prodrug is re-plotted on a smaller scale.

