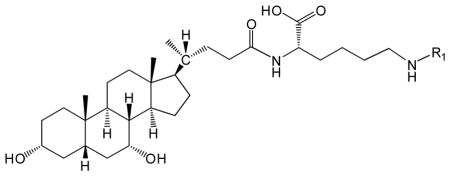
Table 1.
Structure and NMR results of CDCA-lysine-niacin and CDCA-lysine-ketoprofen.
 | ||
|---|---|---|
| Conjugate | R1 | 1H-NMR (DMSO-d6)a |
| CDCA-lysine-niacin |  |
11.95 (1H, s, γ), 8.99 (1H, s, α), 8.69 (1H, d, α), 8.64 (1H, t, β), 8.17 (1H, d, α), 7.92 (1H, d, β), 7.48 (1H, t, α), 4.30 (1H, m, θ), |
| CDCA-lysine-ketoprofen |
 O O
|
11.65 (1H, s, γ), 7.98 (1H, d, β) 8.04 (4, t, β) 7.78-7.58 (9H, α), 4.13(1H, m, γ) 3.68 (1H, m, α), 1.37 (3H, s, α) |
Only characteristic peaks are shown. CDCA and methylene peaks are not shown.
Values are in ppm relative to TMS. α indicates assignment to proton peaks in R1; β indicates assignment to protons in amide; γ indicates assignment to protons in carboxylic acid region; θ indicates the proton in α carbon.
