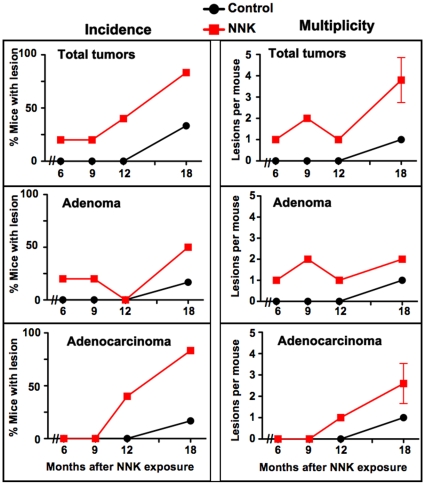
Figure 2. Increased incidence and multiplicity of lung tumors in Gprc5a-knockout mice exposed to NNK compared to control mice.
Graphs depicting the percentage of mice with lung tumors (left panels) and number of tumors per mouse as a measure of multiplicity (right panels) in the control (orange line) and NNK-exposed (black line) groups at 6, 9, 12 and 18 months following injection with the carcinogen.

