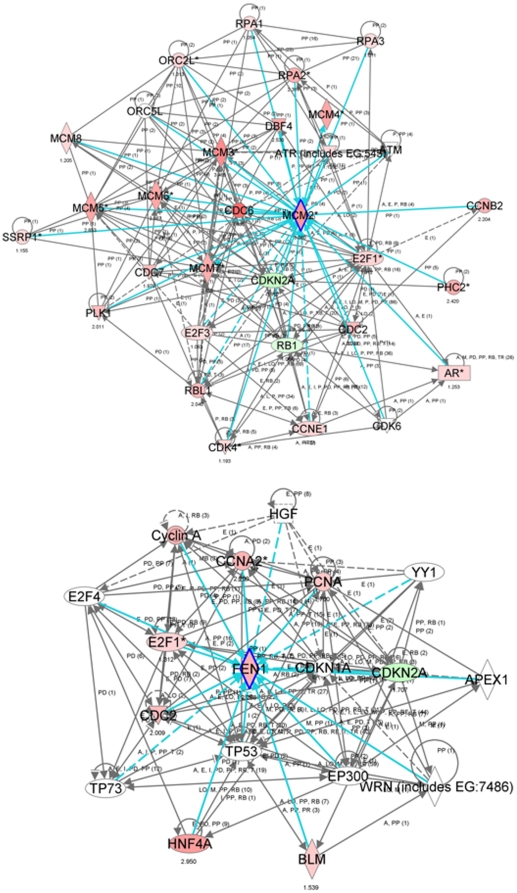
Figure 6. Gene-interaction network analysis of genes differentially expressed between both mouse and human normal lung epithelial and adenocarcinoma cells.
IPA® analysis of gene-interaction networks and neighborhoods involving the selected genes, Mcm2 (top) and Fen1 (bottom), differentially expressed between Gprc5a −/− normal lung cells and adenocarcinomas as well as between human normal NHBE cells and 1170-I tumorigenic cells (highlighted in inlet of 5B). Interaction nodes of the Mcm2 and Fen1 genes are highlighted by a blue border. Gene expression variation by at least 2-fold is depicted by color (red, up-regulated; green, down-regulated).

