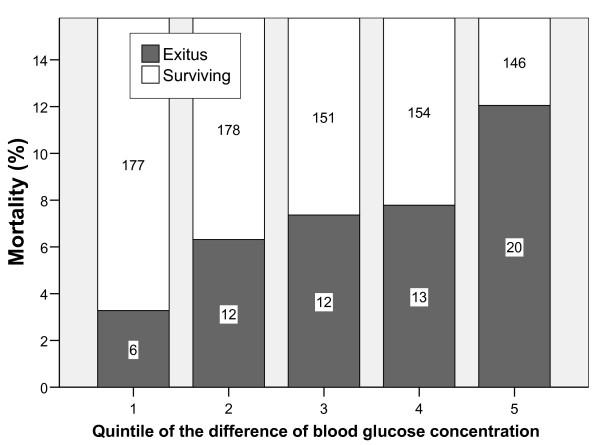
Figure 2.
Mortality according to deviation of blood glucose concentration with the reference blood glucose concentration of 155 mg/dL which is the central value of the interval with the lowest mortality. Patients are distributed in quintiles of the difference in blood glucose concentration. The numbers inside the bars reflect the number of patients in each group (p = 0.002 chi square for linear trend).

