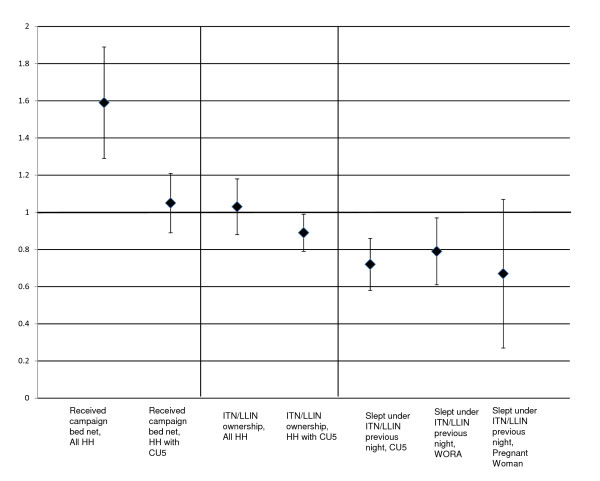
Figure 3.
Equity ratios for selected indicators*. *An equity ratio of more than 1 means that the poorest quintile was more likely to receive the intervention, less than 1 means that the wealthiest quintile was more likely to receive the intervention. Sample sizes: Number of households: 2059; Number of Households with CU5s: 1113, Number of Households with Women of Reproductive Age (WORA): 1613; Number of CU5s: 1727, Number or WORAs: 2053, Number of Pregnant Women: 182.

