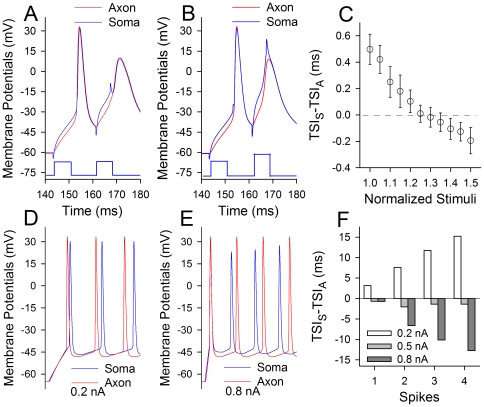
Figure 2. Sequential spikes are initiated at the soma when input intensity increases.
In A–C, whole-cell recoding was done at the soma and axon of identical neurons when the paired-current pulses were injected into the soma (blue traces in A–B). A–B) show the comparisons in the time of spike initiation (TSI) at the soma (blue traces) and axon (reds), when the intensities of second pulse were low (A) and high (B). TSI for the soma appears moving in front of the axon when stimulus intensity is raised. C) shows the difference of TSI at the soma and axon versus the normalized stimulus intensity, in which the negative values of TSIS-TSIA indicate somatic spikes ahead of axonal ones. D–E) computation-simulated sequential spikes at the soma (blue traces) and axon (reds) when stimulus intensities are 0.2 and 0.8 nA, respectively, in which the strong stimuli switch somatic spikes with decreased amplitudes being ahead of axonal ones. F) illustrates the quantitative data of TSIS-TSIA for simulated spikes 1–4 under stimulus intensities at 0.2 (white bars), 0.5 (light grays) and 0.8 nA (dark grays), in which the negative values of TSIS-TSIA indicate somatic spikes ahead of axonal ones.

