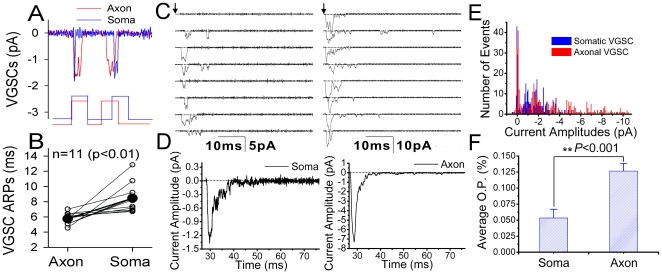
Figure 7. The comparison of refractory period, current amplitude and open probability of voltage-gated sodium channels (VGSC) at the axon vs. soma.
Pair-recordings in cell-attached model were conducted at axonal bleb and soma on the same neurons. Two depolarization pulses (5 ms) at thresholds for VGSC activation are given, and the delay of pulse two is adjusted to measure absolute refractory period (ARP) for VGSC reactivation. A) Single VGSCs reopen 4.5 ms after ARP at the axon (red line), and 7 ms after ARP at the soma (blue). B) shows that the averaged ARP for axonal VGSCs and somatic ones are 5.45±0.2 ms and 8.45±0.54 ms, respectively (n = 11, p<0.01). VGSCs also were activated by 60 ms depolarization pulse. C) shows the currents of single VGSCs recorded on the soma (left) versus axonal bleb (right). D) illustrates the averaged amplitudes of VGSC currents on the soma (left, 1.35 pA) and axonal bleb (right, 7.3 pA) E) shows the distributions in the amplitudes of VGSC currents recorded on the soma (blue bars) and axonal bleb (reds). F) shows the opening probability of VGSCs recorded on the soma (left, 0.055±0.015) and axonal bleb (right, 0.127±0.013; p<0.001).

