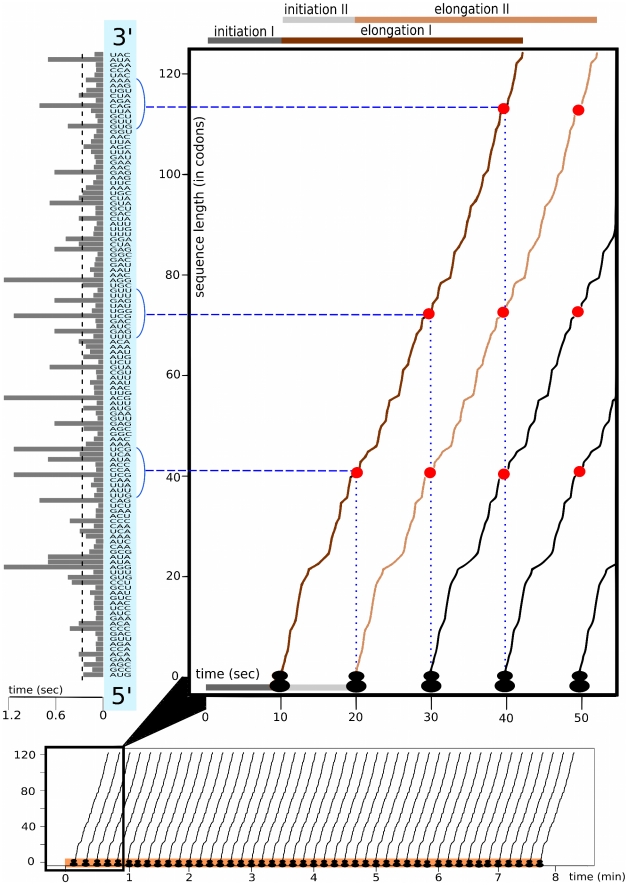
Figure 1. Translation model of YJL173C.
The bottom plot shows all of the translation initiation events during the mean lifetime of one mRNA molecule. Translation initiations are marked with ribosome-shaped symbols. The orange line indicates the mean lifetime of YJL173C mRNA. The broken curves' slope depicts the rate of polypeptide chain growth measured at particular codons. The number of curves indicates the number of protein molecules (here 46) produced from one mRNA during its lifetime. The top-right plot shows, in magnitude, the translation of the first protein molecule (darkbrown curve). The time is measured since the transcript becomes accessible to the translation machinery. The first seconds are spent on translation initiation; elongation begins after about 10 sec. Red dots mark ribosome positions in time (dotted blue lines) and space (dashed blue lines) when the following ribosomes attach to the mRNA molecule. The histogram on the left shows the mean translation times of particular codons of the YJL173C sequence. The dashed black line is the mean time of translation of one codon of the YJL173C mRNA sequence.

