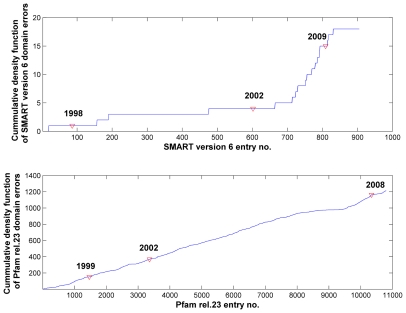
Figure 1. Cumulative plots of SMART version 6 and Pfam release 23 problematic domains.
In SMART version 6, the total number of domains with predicted SP/TM segments peaks at 18, which made up 2.2% of 809 SMART domains (see top). Red triangles mark time points for the years 1998, 2002 and 2009 when the total number of domain models was 86, 600 and 809 respectively. In Pfam, the total number of problematic domains peaks at 1214, which made up 11.8% of 10340 Pfam domains (see bottom). Likewise, red triangles marked the years 1999, 2002 and 2008 with 1465, 3360 and 10340 Pfam entries respectively.

