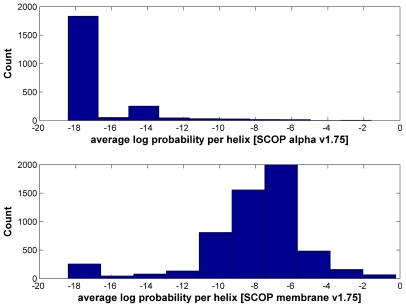
Figure 7. Histograms of average log probability per predicted transmembrane helix for SCOP v1.75 α-proteins class and membrane protein class.
The top (average log probability per predicted transmembrane helix for SCOP v1.75 α-proteins class) and bottom (average log probability per predicted transmembrane helix for SCOP v1.75 membrane protein class) histograms represent the false-positive and true-positive distributions for TM predictions respectively. The total number of predicted structural and membrane helices is 2293 and 5592 respectively.

