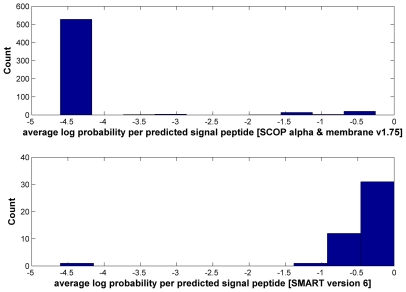
Figure 8. Histograms of average log probability per predicted signal peptide for SCOP v1.75 α- and membrane protein class and SMART version 6.
The top (average log probability per predicted signal peptide for SCOP v1.75 α- and membrane protein class) and bottom (average log probability per predicted signal peptide for SMART version) histograms represent the false-positive and true-positive distributions for the SP predictions respectively. The total number of predicted signal peptides for SCOP α- and membrane proteins is 193 and 379 respectively, while the total number for SMART is 45. All except SM00817 Amelin (no available structure) were validated against their respective PDB entries.

