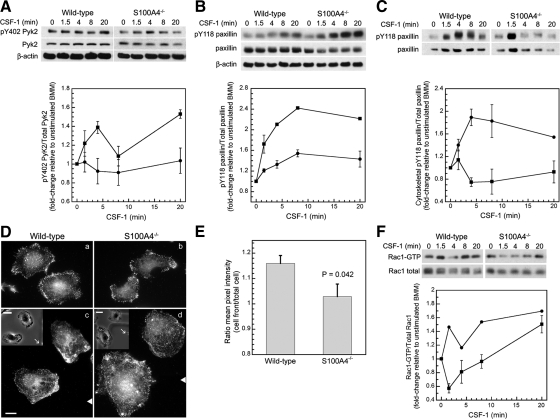
Figure 7.
S100A4−/− BMMs exhibit an altered response to CSF-1 receptor signaling. Analysis of cell signaling in CSF-1–stimulated wild-type (circles) and S100A4−/− (squares) BMMs. Phosphorylation or activation is expressed as the fold change relative to unstimulated cells. Data represent the mean for two to four independent experiments. SEs are shown only for data points from three or four independent experiments. (A) Top, representative immunoblot of pY402 Pyk2, total Pyk2, and β-actin. Bottom, kinetics of Pyk2 Y402 phosphorylation. (B) Top, representative immunoblot of pY118 paxillin, total paxillin, and β-actin. Bottom, kinetics of paxillin Y118 phosphorylation. (C) Top, representative immunoblot of pY118 paxillin and total paxillin from Triton-insoluble cytoskeletons of stimulated cells. Bottom, kinetics of pY118 paxillin associated with Triton cytoskeletons. (D) Paxillin pY118 localization in globally (a and b) and directionally (c and d) CSF-1–stimulated wild-type and S100A4−/− cells. (c and d) White triangles indicate the position of the micropipette relative to the cells (not the actual distance). Bar, 10 μm. Inset, phase images of cells at the start of CSF-1 stimulation. White arrows indicate the position of the micropipette. Bar, 20 μm. (E) Quantification of pY118 paxillin in directionally stimulated cells. The cell front is defined as a 90° wedge facing the micropipette. Values represent the ratio ± SEM for 10 wild-type and nine S100A4−/− BMMs. (F) Top, representative immunoblot of GTP-bound and total Rac1. Bottom, kinetics of Rac1 activation.

