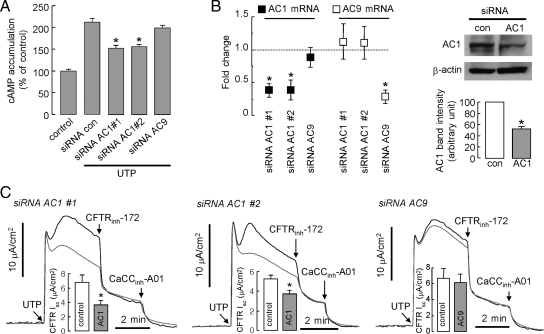
Figure 8.
Evidence for AC1 as responsible for cAMP generation after Ca2+ elevation. (A) cAMP accumulation in HBE cells measured after transfections with siRNAs (against AC1 and AC9) in response to addition of UTP (100 μM; SE; n = 4–5). (B) Left, relative mRNA expression of AC1 and AC9 as measured real-time RT-PCR; right, AC1 immunoblot at 48 h after transfections with negative control siRNA and siRNA AC1 #1. Band intensities are summarized in bar graph format (error bars, SE; n = 3). (C) AC1 and AC9 were knocked down by siRNAs. UTP-induced activation of CFTR-dependent (CFTRinh-172 inhibited) currents measured in siRNAs-treated HBE cells. CFTR-dependent Isc is summarized in bar graph format (error bars, SE; n = 4–5). *p < 0.05 compared with control.

