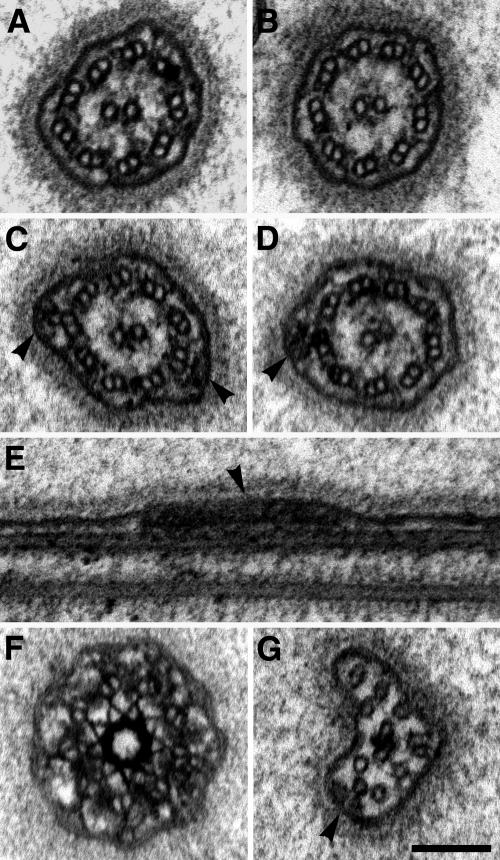
Figure 8.
The flagella of IFT70/CrDYF-1 knockdown cells display a normal ultrastructure. (A) Cross section of a flagellum of a C. reinhardtii cw92 cell showing the 9 + 2 microtubule architecture of the axoneme. (B–G) Electron micrographs of flagella of IFT70/CrDYF-1 knockdown cells (strain miRNA-4). (B–D) Cross sections of flagella. IFT-trains (arrowheads) attached to the B-subfiber of outer-doublets are visible. (E) Longitudinal section of a flagellum with a visible IFT-train (arrowhead). (F) Cross section through a transition zone showing a normal ultrastructure. (G) Cross section through the distal tip of a flagellum. An IFT-train is visible (arrowhead). Scale bar, (A–G), 100 nm.

