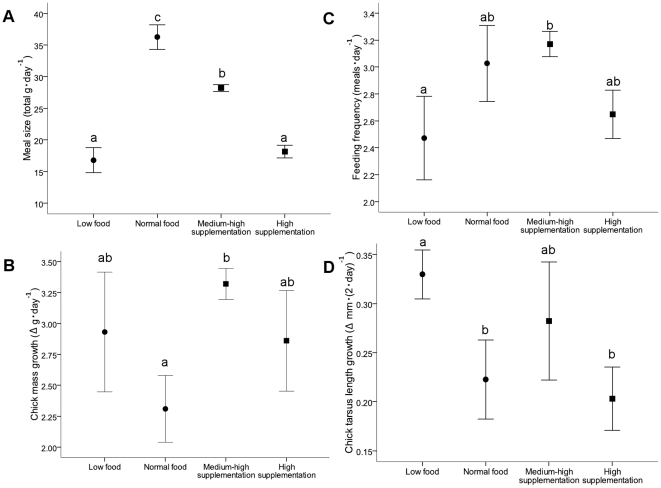
Figure 3. Effect of differences in prey availability.
Mean±2 SE of total daily (A) meal sizes (g) and (B) number of meals provided by adult black noddies that were exposed to four different prey availabilities, two of which were natural (low and normal food) and two of which included diet supplementation (medium-high and high supplementation). Mean (C) chick mass accumulation (as 24-hr chick growth (g)) and (D) skeletal growth (as 48-hr tarsus length (mm)) are also shown. Different letters above the error bars indicate significant differences at P = 0.05 level in a Tukey HSD test.

