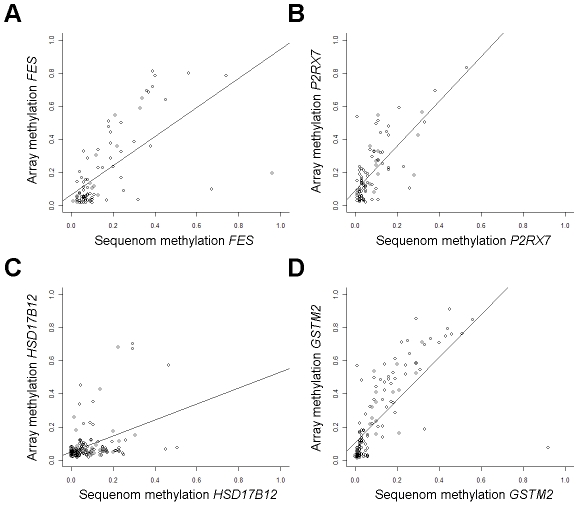
Figure 2. Array methylation is validated by Sequenom EpiTYPER.
Results from GoldenGate array methylation values are plotted versus Sequenom EpiTYPER quantitative methylation values. (A) Sequenom FES methylation is significantly correlated with GoldenGate methylation average β at the coordinate array CpG (Spearman correlation rho = 0.68, P = 1.1E-12, n = 85). (B) Sequenom P2RX7 methylation is significantly correlated with GoldenGate methylation average β at the coordinate array CpG (rho = 0.65, P = 8.6E-12, n = 88). (C) Sequenom HSD17B12 methylation is significantly correlated with GoldenGate methylation average β at the coordinate array CpG (rho = 0.34, P = 5.4E-05, n = 137). (D) Sequenom GSTM2 methylation is significantly correlated with GoldenGate methylation average β at the coordinate array CpG (rho = 0.83, P<2.2E-16, n = 140).

