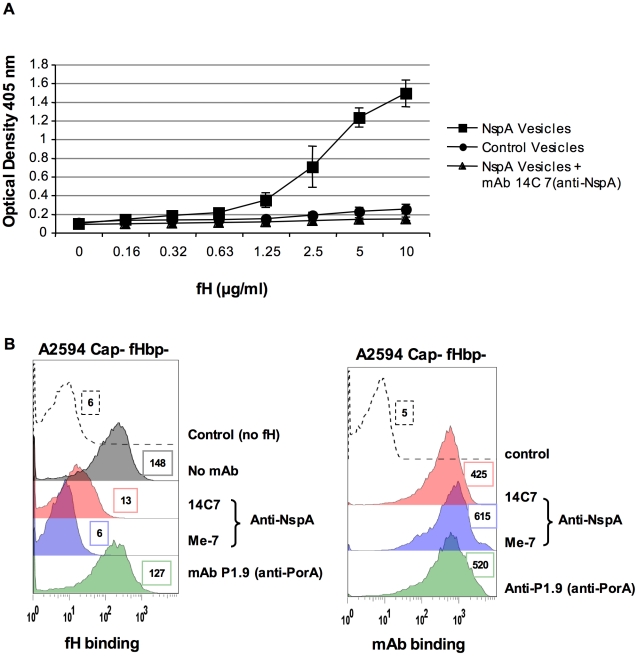
Figure 6. Recombinant NspA expressed in E. coli vesicles binds to fH.
A. Binding of fH to microvesicles prepared from an E. coli strain expressing recombinant NspA (squares) or to vesicles prepared from the same E. coli strain transformed with the plasmid without the nspA gene (circles) was measured by ELISA. Binding of fH to vesicles harboring recombinant NspA was blocked by the anti-NspA mAb 14C7 (triangles). Each data point represents the arithmetic mean of the OD405nm reading from three independent experiments and error bars represent the standard deviation. B. Binding of fH to A2594 Cap− fHbp− LNT LOS sia− was measured in the presence of anti-NspA mAb Me-7 (purple shaded histogram), anti-NspA mAb 14C7 (pink shaded histogram) or anti-PorA mAb P1.9 (green shaded histogram); all mAbs were used at a concentration of 30 µg/ml and fH binding was detected using sheep anti-human fH. The control (histogram depicted by a dashed line) represents bacteria incubated with mAb Me-7, followed by addition of anti-fH and anti-sheep IgG FITC. A control where fH binding was measured in the absence of any added mAb is shown by the grey shaded histogram in the left panel. Surface binding of each mAb (shading as described above) to A2594 Cap− fHbp− LNT LOS sia− is also shown. The control (dashed line) represents bacteria incubated with anti-mouse IgG FITC. Median fluorescence is indicated to the right of each histogram.

