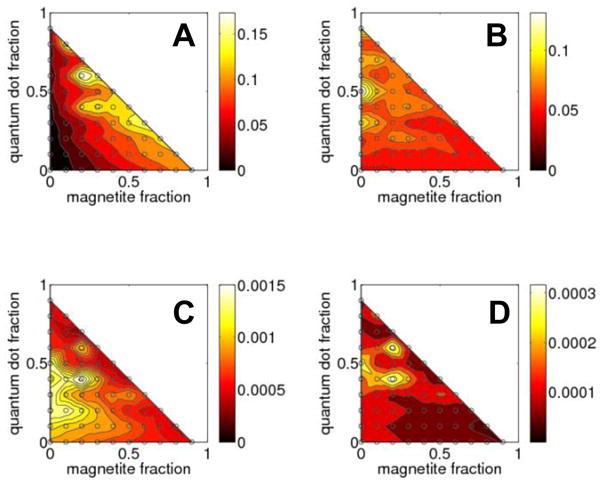
Figure 6.

Power deposited in sphere (A) and scattered through silica (B) at the absorption stage; power emitted from the sphere (C) and transmitted through silica (D) at the fluorescence stage. All power is plotted as a function of magnetite and QD volume fractions. (TE polarization, θ=75°, bead diameter is 1.0 μm, the distance from silica is 60 nm, incident λ=532 nm, fluorescence λ=597 nm).
