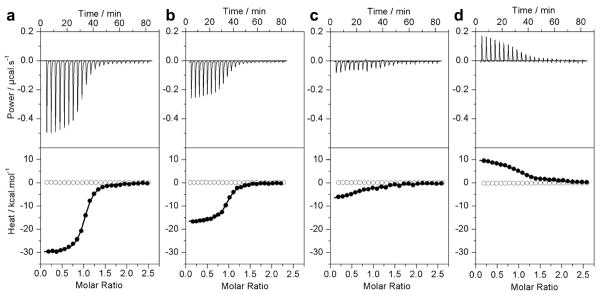
Figure 2.
Representative ITC isotherms for the binding of ERE duplex to the wildtype DB domain of ERα in Phosphate (a), Hepes (b), Tricine (c) and Tris (d) buffers at pH 7.0 and 25°C. The upper panels show the raw ITC data expressed as change in thermal power with respect to time over the period of titration. In the lower panels, change in molar heat is expressed as a function of molar ratio of ERE duplex to dimer-equivalent DB domain (●). The solid lines in the lower panels show the fit of data to a one-site model, as embodied in Eq [1], using Microcal Origin software. Note also that the DB domain shows no non-specific binding to scrambled dsDNA oligos (○).

