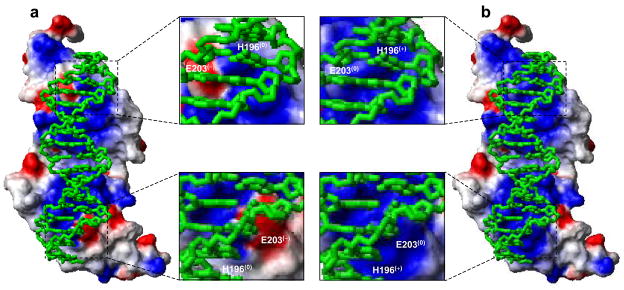
Figure 7.
Molecular surfaces depicting electrostatic potentials of the DB domain of ERα containing H196 and E203 in unprotonated forms (a) and protonated forms (b) in complex with the ERE duplex. The blue and red colors respectively denote the density of positive and negative charges, while the apolar and polar surfaces are indicated by white/gray color on the molecular surfaces. In the expanded views, the locations of H196 and E203 are clearly marked on the molecular surfaces with the parenthesis indicating the overall charge on each residue under unprotonated and protonated forms. The ERE duplex is displayed as a stick model and colored green for clarity.

