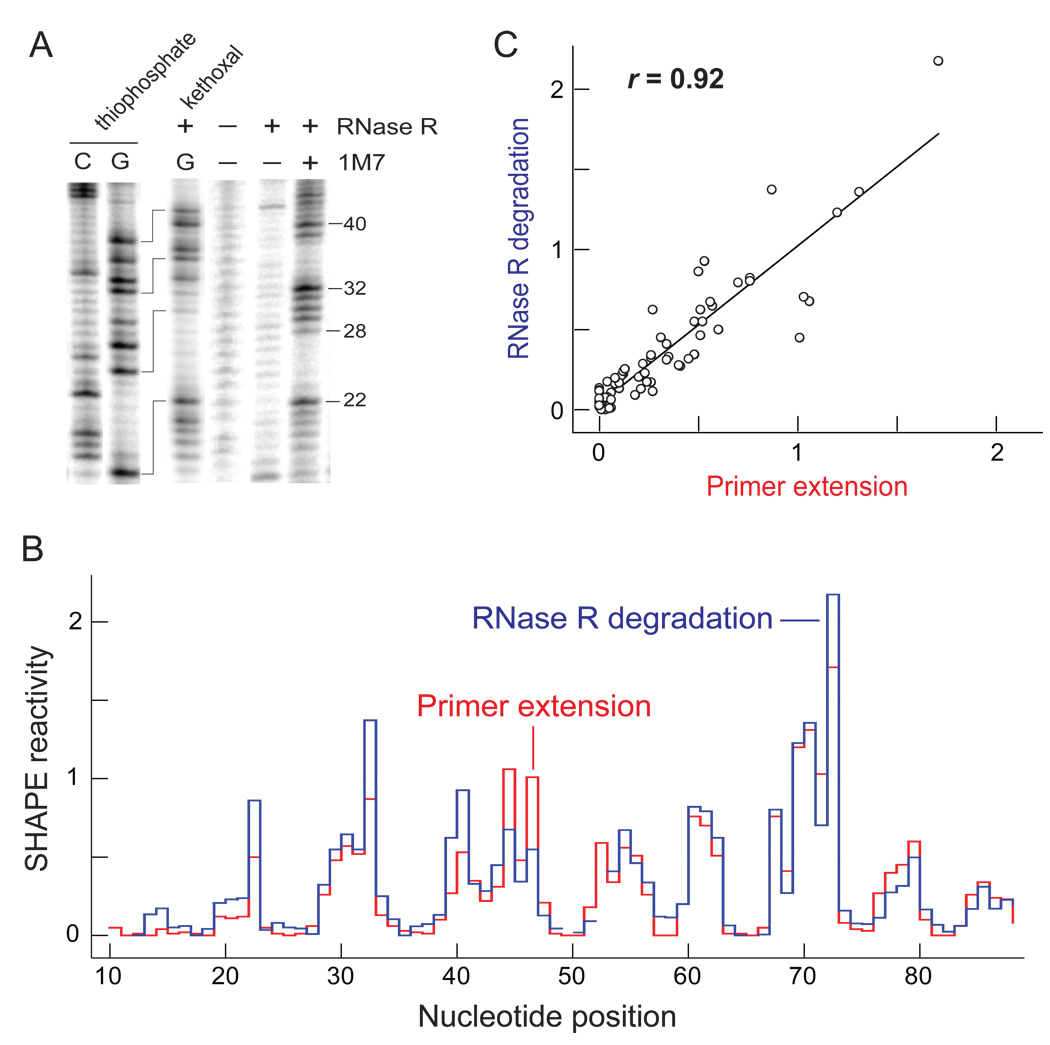
Figure 2.
Quantitative detection of 2′-O-adducts by RNase R degradation. (A) Comparison of RNase R degradation of 5'-end labeled RNAs containing 1M7 adducts with C and G sequencing ladders, visualized by gel electrophoresis. Sequencing ladders were generated either by I2 cleavage of phosphorothioate-containing RNAs or as kethoxal-mediated stops to RNase R degradation. The kethoxal marker lane fragments (G) are one nucleotide shorter than those in the 1M7 lanes. (B) Histograms comparing absolute SHAPE reactivities as determined by RNase R degradation and primer extension. Nucleotides that could not be analyzed due to high background are indicated by breaks in the plot. (C) Correlation between SHAPE reactivities detected by RNase R degradation and primer extension. Pearson’s linear r-value is shown.

