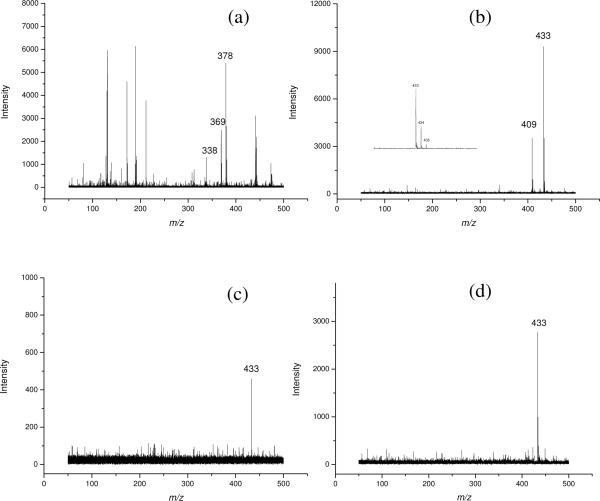
Figure 5.
MALDI-TOF mass spectra of: (a) cholesterol (m/z 369, [M-H2O+H]+) and squalene (m/z 433, [M+Na]+) with the use of CHCA as matrix; (b) cholesterol (m/z 409, [M+Na]+) and squalene (m/z 433, [M+Na]+), with the use of graphene as matrix; (c) graphene as adsorbent for SPE of squalene at 20 μM; (d) graphene as matrix for SPE of squalene at 0.2 μM.

