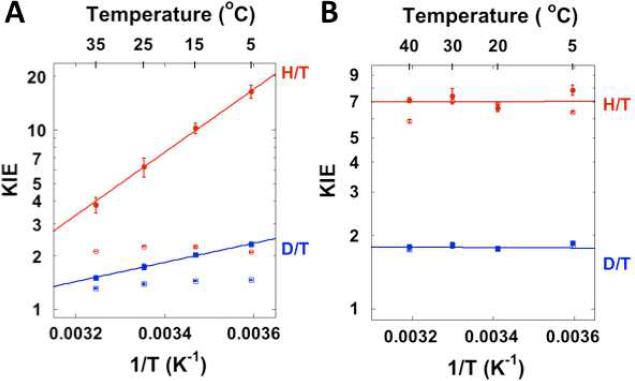
Figure 2.
Arrhenius plots of observed (empty structures) and intrinsic (filled structures) primary KIEs on the proton transfer (A) and the hydride transfer32 (B) catalyzed by E. coli TSase. The KIEs are shown as average values and standard deviations, while the lines are the non-linear fittings of all calculated intrinsic KIEs (see text) to the Arrhenius equation.44

