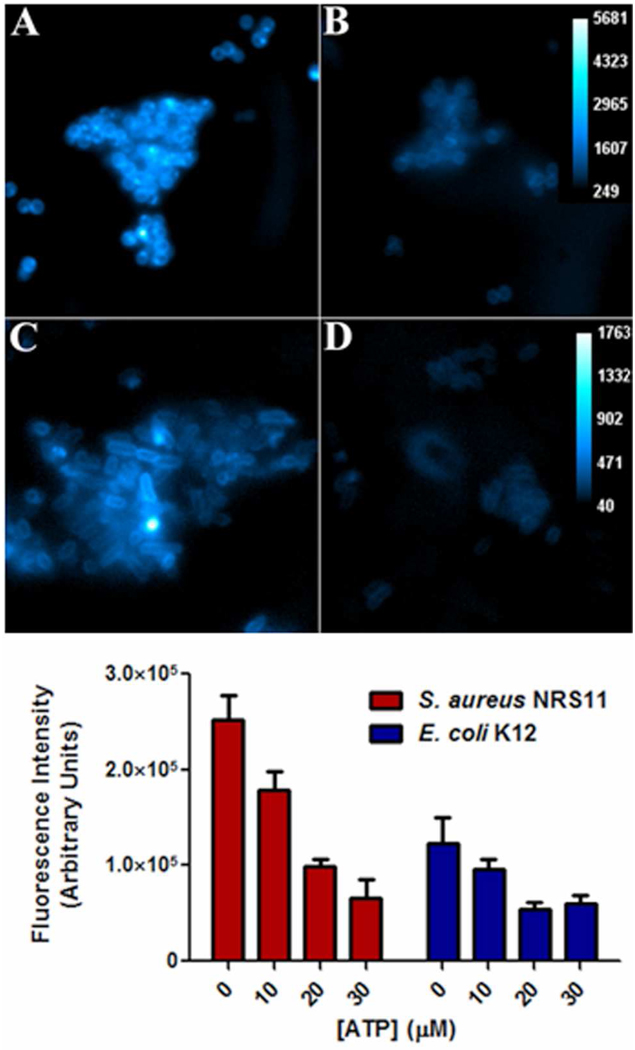
Figure 3.
(top) Fluorescence micrographs showing intensity of probe 1 (10 µM) staining of S. aureus NRS11 in the absence (panel A) and presence of 30 µM ATP (panel B), and intensity of E. coli K12 staining in the absence (panel C) and presence of 30 µM ATP (panel D). (bottom) Change in probe 1 staining intensity of bacteria as a function of added ATP.

