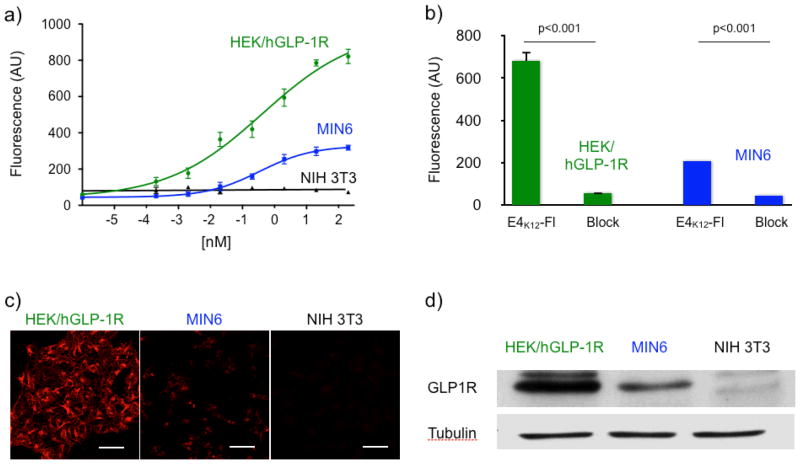
Figure 3.
(a) Dose-response curves of E4K12-Fl where GLP-1R is either overexpressed (HEK/hGLP-1R) or naturally expressed (MIN6), and of a GLP-1R negative (NIH 3T3) cell line; (b) blocking of E4K12-Fl (10 nM) with Exendin-4 (100 nM); (c) Live cell microscopy; HEK/hGLP-1R, MIN6 or NIH 3T3 cells were treated with E4K12-Fl (10 nM) and then imaged. Scale bar: 50 μm (d) Western Blot of HEK/hGLP-1R, MIN6 and NIH 3T3 cell lines against GLP-1R and tubulin.

