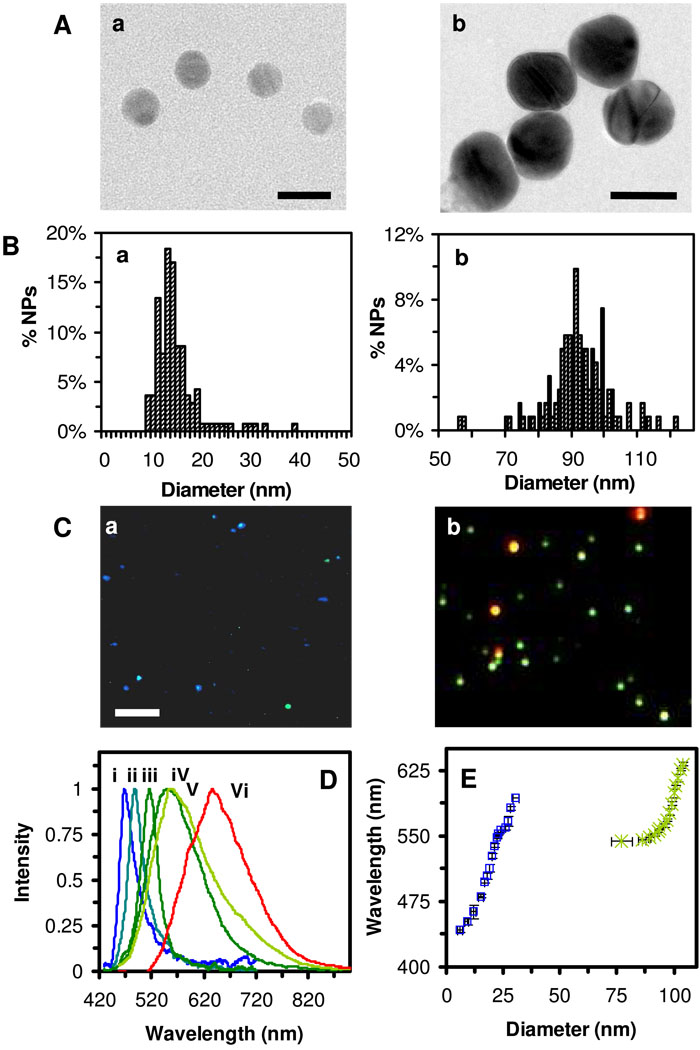
Figure 1. Characterization of the size and plasmonic optical properties of single Ag NPs.
(A) HRTEM images and (B) Histograms of size distributions of Ag NPs show nearly spherical NPs with narrow size distribution at the diameters of (a) 13.1 ± 2.5 nm and (b) 91.0 ± 9.3 nm.
(C) Their dark-field optical images show plasmonic colors with (a) 73% of blue, 21% of green and 6% of red NPs; and (b) 68% of green, 16% of yellow and 16% of red NPs, respectively. See Figure 1S in supporting information.
(D) Representative LSPR spectra of single Ag NPs in (a) and (b) show the peak wavelength (λmax) of (a): (i) 468, (ii) 488 and (iii) 577 nm; and (b): (iv) 552, (v) 560 and (vi) 637 nm, respectively.
(E) Correlation of the λmax of LSPR spectra of single Ag NPs with their sizes shows linear calibration curves for Ag NPs in (a) and (b), allowing us to determine the sizes of NPs in solution and in living cells in real-time using DFOMS. Scale bars in (A-a), (A-b), and (C) = 25 and 90 nm, and 4 µm, respectively. The scale bar in (C) shows the distances among NPs, but not the sizes of NPs, because they are imaged under optical diffraction limit (~200 nm).

