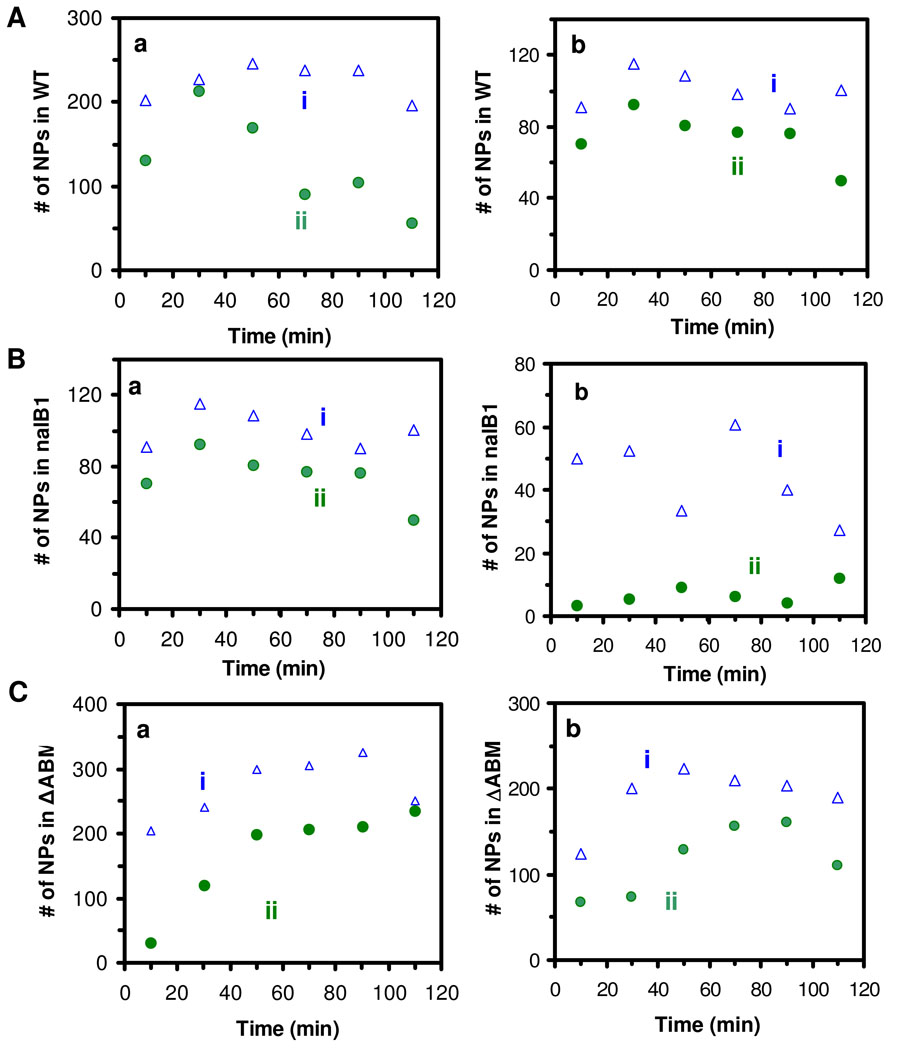
Figure 5.
Study of concentration-dependent transport rates of Ag NPs in single living cells. Plots of intracellular NPs in (A) WT, (B) nalB1 and (C) ΔABM versus time, for the cells that are incubated with (a) 13.1 ± 2.5 nm NPs at concentrations of (i) 190 pM and (ii) 96.3 pM; and (b) with 91.0 ± 9.3 nm NPs at concentrations of (i) 1.85 pM and (ii) 0.93 pM, respectively. We analyzed 800 cells at each 20 min over 2 h for each data point.

