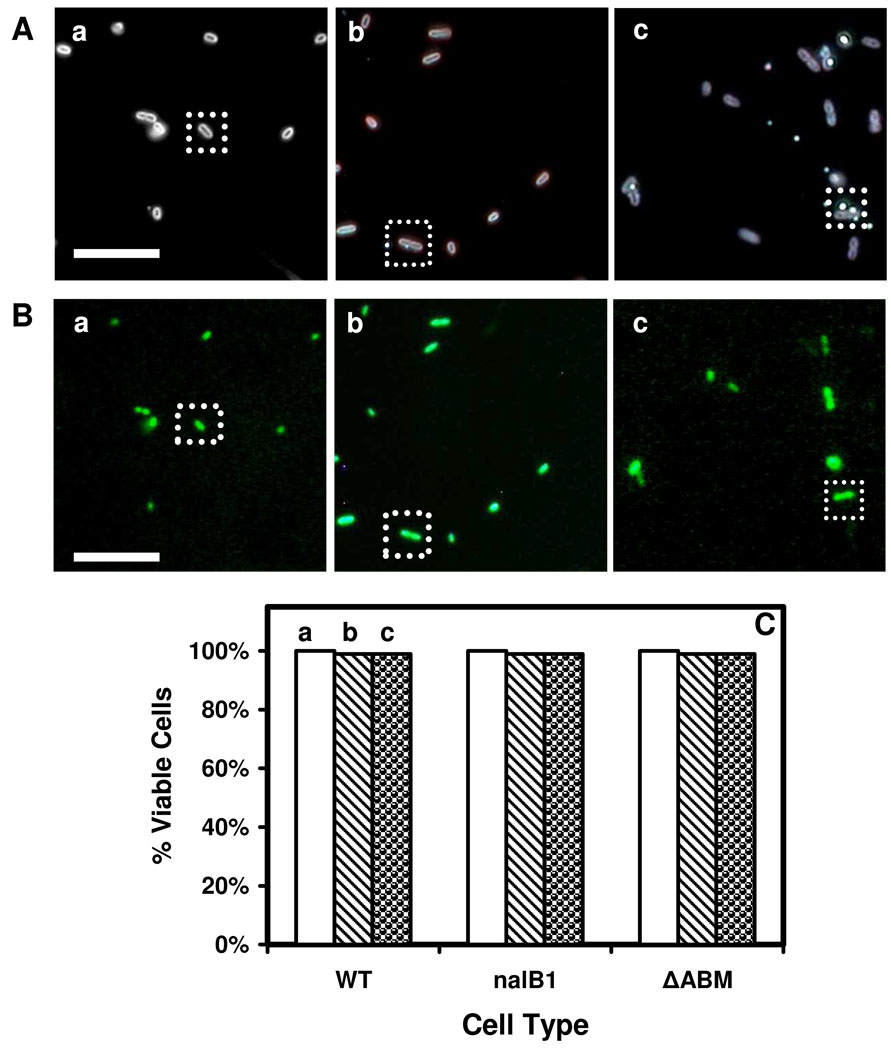
Figure 6.
Characterization of cellular viability: (A) Optical images of cells (WT, nalB1, ΔABM) that are incubated with (a) the buffer (blank control), (b) 3.7 pM of 91.0 nm NPs and (c) 770 pM of 13.1 nm NPs for 12 h; (B) Fluorescence images of the cells in (A), that are assayed using live/dead bacLight assays, show that the cells are alive. The scale bars in (A-B) are 8 µm. (C) More than 99% of the cells (WT, nalB1, ΔABM) in (A) are viable.

