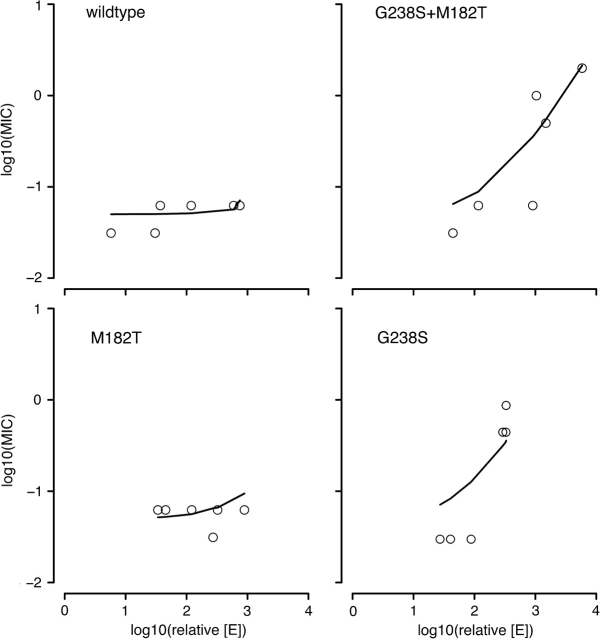
FIG. 3.—
Comparison of predicted MIC values (solid lines) and observed data (open circles) for four alleles as a function of relative enzyme concentrations ([E]). Predicted MIC values are based upon the Zimmerman and Rosselet (1977) model, whereas observed data represent laboratory MIC measurements. Relative enzyme concentrations for G238S were adjusted to correct for unusual sensitivity to protein extraction procedures. For MIC predictions for each allele over the entire theoretical range of expression, see supplementary figure S4 (Supplementary Material online).

