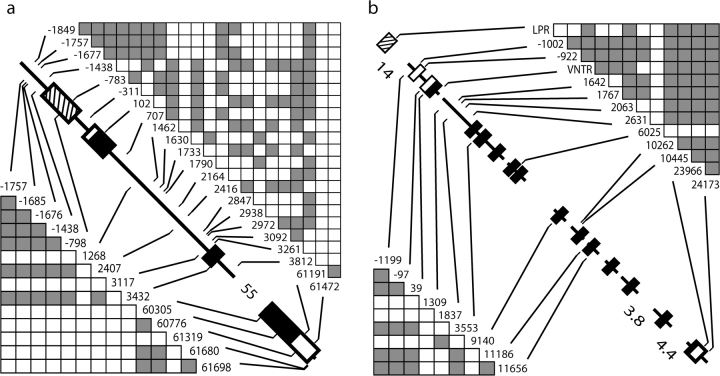
FIG. 1.
Gene diagrams for the (a) ∼63-kb HTR2A locus and (b) ∼38-kb SLC6A4 locus (with promoter “LPR” and intron 2 “VNTR” variants). Black boxes denote amino acid coding exons, white boxes denote UTRs, and striped boxes denote functionally identified promoter regions. SNP numbering is with respect to the beginning of amino acid translation. Genes are to scale (except where noted with collapsed distances in kb), and only regions for which data were collected are shown. Significant pairwise associations (filled boxes) among informative variants in 192 human (>5% in frequency) and 40 chimpanzee (>12% in frequency) chromosome sequences are above and below gene diagrams, respectively (see Materials and Methods and Results for more details).

