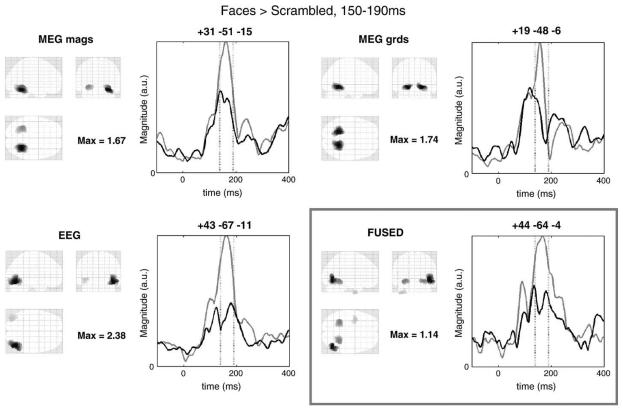
Fig. 4.
Mean source reconstructions across participants for the contrast of faces versus scrambled faces within a Gaussian window centred between 150 and 190 ms when inverting data from each sensor-type separately, and when inverting simultaneously (bottom right panel). The left part of each panel shows a Maximal Intensity Projection (MIP) of the 128 greatest source strengths within MNI space; the right part shows the magnitude of the evoked response to faces (light lines) and scrambled faces (dark lines) across the epoch for the maximum in each MIP. For illustration purposes, the source estimates have been smoothed on the 2D mesh surface via 32 iterations of a graph Laplacian with adjacency ratio (c.f., autoregression coefficient) of 1/16.

