Figure 5.
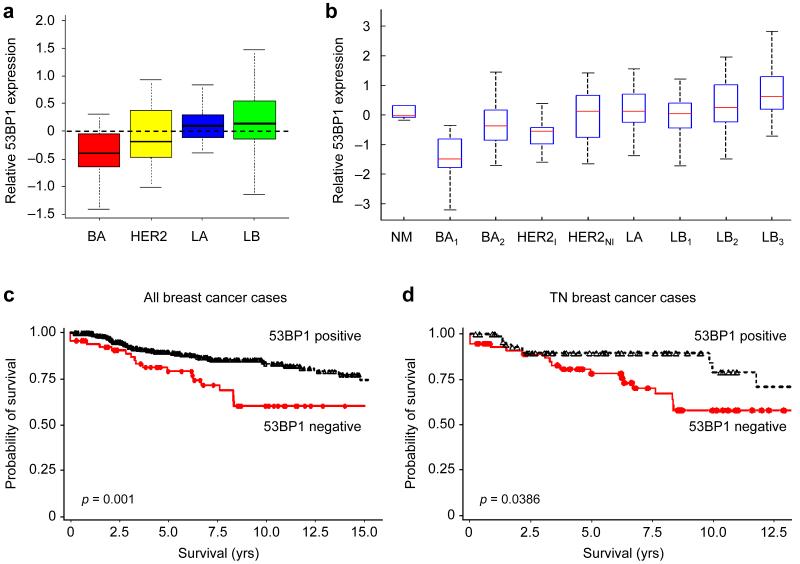
53BP1 expression is reduced in a subset of human BLBC. (a) Boxplots showing 53BP1 expression levels among breast cancer subtypes. Gene expression array data from 286 early stage breast cancers published by Wang et al.33 were clustered to classify tumors into basal (BA), HER2-positive (HER2), Luminal A (LA) and Luminal B (LB). The mean expression values of 53BP1 are shown for each subgroup. (b) Boxplots showing 53BP1 expression levels among different breast cancer subtypes defined by robust consensus clustering: normal (NM), basal (BA1, BA2), HER2-positive (HER2I, HER2NI), and luminal (LA, LB1, LB2, LB3). The data are normalized with mean expression of the combined data being set to 0. Expression of 53BP1 is significantly lower in the BA1 subtype (p<0.0001 vs. Normal; p<0.0002 vs. BA2). (c-d) Distant relapse-free survival stratified by 53BP1 protein expression in all breast cancers (c) and in triple-negative (TN) breast cancers (d). Kaplan-Meyer survival curves for distant relapse-free survival are shown for breast cancers that scored positive for 53BP1 staining (black lines) and those that scored negative for 53BP1 staining (red lines).

