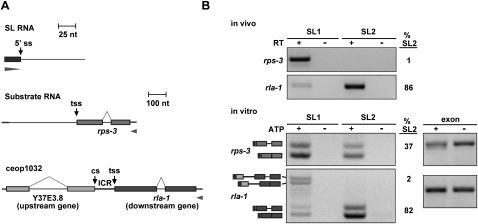
Figure 1.
The in vitro trans-splicing system recapitulates in vivo SL specificity. (A) Diagram of in vitro splicing RNA substrates. The SL1 and SL2 RNAs are present in the extract. rps-3 is trans-spliced to SL1 in vivo. rla-1 is a downstream gene in operon ceop1032, and is trans-spliced to SL2 in vivo. (tss) Trans-splice site; (cs) cleavage site; (ICR) ICR between upstream gene Y37E3.8 and downstream gene rla-1. Bars: for SL RNAs, 25 nt; for substrate RNAs, 100 nt. Boxes represent exons, and arrowheads represent the locations of RT and PCR primers. Forward primers are specific for the SL sequences of the endogenous SL1 or SL2, and reverse primers are specific to the substrate RNA. (B, top) RT–PCR with RNA from whole worms. Forward primers are specific for SL1 or SL2, and reverse primers are specific for rps-3 and rla-1. Lanes 2 and 4 lacked reverse transcriptase. Percent SL2 (%SL2; SL2 divided by the sum of SL1 and SL2) is given for the +RT reactions. (Bottom) RT–PCR of in vitro splicing reactions. Lanes 2 and 4 lacked ATP, creatine phosphate, and creatine phosphokinase. Reverse primers are specific for the splicing substrate RNA. Spliced products for the rps-3 and rla-1 substrates are shown (determined by sequencing the PCR products). The top bands in the rla-1 panel arise from splicing of SL1 to the last cis-splice site in the upstream operon gene. (Dark gray) 22-nt SL; (lighter gray) rps-3 and rla-1 spliced substrates. Percent SL2 is given for the +ATP reactions. Exon lanes are RT–PCR products using forward and reverse primers specific for the substrate, and are used as a measure of input RNA.

