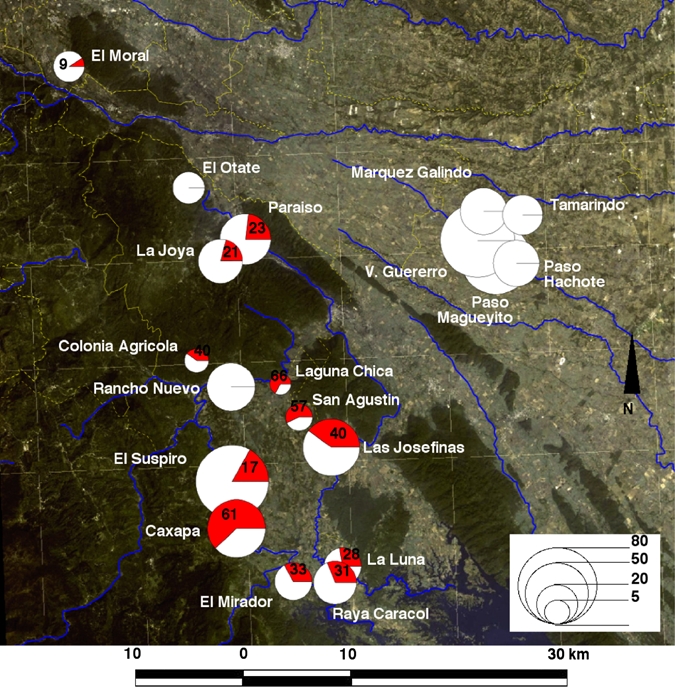
Figure 2.

Geographic distribution of Trypanosoma cruzi infection in central Veracruz, Mexico. Circles are proportional to the number of serum samples analyzed in each village as indicated on the bottom right scale. Red areas in the pie charts represent the proportion of T. cruzi-seropositive patients, which is also indicated for villages with seropositive patients. Background image shows a satellite image of the area with blues lines indicating rivers and yellow lines indicating boundaries of the municipalities. This figure appears in color at www.ajtmh.org.
