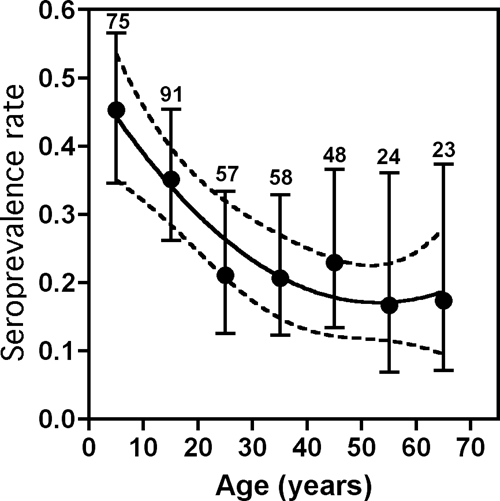
Figure 3.

Distribution of Trypanosoma cruzi infection in Tezonapa, Mexico by age groups. The population was stratified according to the indicated age groups and infection rates are shown as mean ± 95% confidence interval. Numbers on the top of the error bars refer to the number of samples for each group. Seroprevalence rates were significantly associated with age (r2 = 0.915, P = 0.004, by second-order polynomial regression), as indicated by the regression line and its 95% confidence area (dotted lines).
