
Table 1.
Survival distributions
| Distribution | Probability density function f(t) | Survival function S(t)* | Parameters | With covariates |
|---|---|---|---|---|
| Exponential | λe−λt | e−λt | λ = rate | 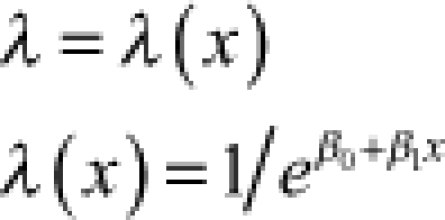 |
| Gamma | 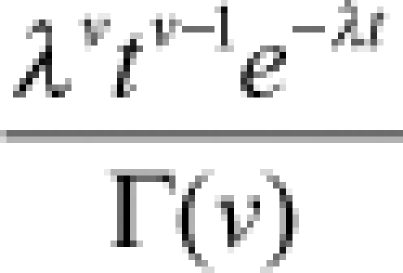 |
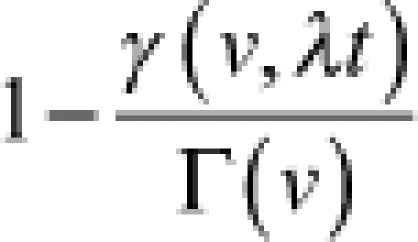 |
λ = rate v = shape | 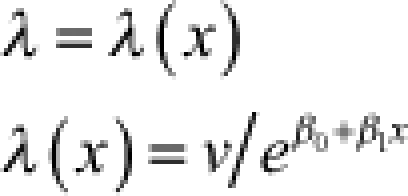 |
| Weibull | 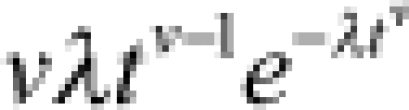 |
 |
λ = rate v = shape | 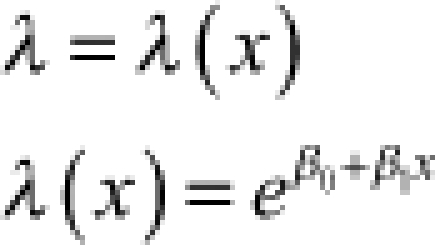 |
| Log-normal | 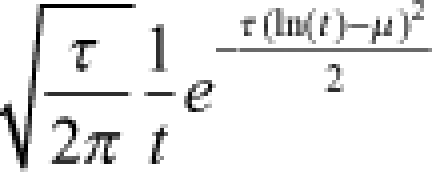 |
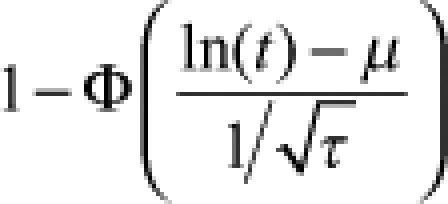 |
μ = mean τ = precision | 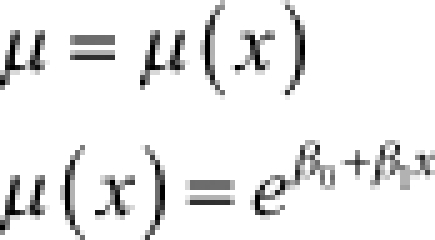 |
*
Φ is the standard normal cumulative distribution function, and γ is the lower incomplete gamma function.