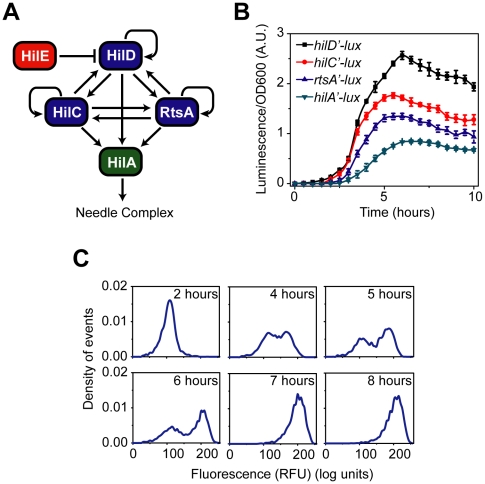
Figure 1. SPI1 gene expression is hierarchical and exhibits a switch-like transition from the “off” to the “on” state.
(A) Diagram of the SPI1 gene circuit. HilA is the master SPI1 regulator as it activates the expression of the genes encoding the T3SS. HilA, in turn, is regulated by HilC, HilD, and RtsA. These three regulators can independently activate HilA expression. They can also activate their own expression and that of each other's. HilE represses the activity of HilD by binding to it and preventing it from activating its target promoters. (B) Time-course dynamics of PhilD (pSS074), PhilC (pSS075), PrtsA (pSS076), and PhilA (pSS077) promoter activities in wild-type cells as determined using luciferase transcriptional reporters. To induce SPI1 gene expression, cells were first grown overnight in LB/no salt and then sub-cultured into fresh LB/1% NaCl conditions to an OD of 0.05 and grown statically. Luminescence values were normalized with the OD600 absorbance to account for cell density. Average promoter activities from three independent experiments on separate days are reported. For each experiment, six samples were tested. Error-bars indicate standard deviation. (C) Dynamics of PhilA (pSS055) promoter activity in wild-type cells as determined using green fluorescent protein (GFP) transcriptional fusions and flow cytometry. The SPI1 gene expression was induced as described above. Samples were collected at the indicated times and arrested in their respective state by adding chloramphenicol. Approximately 30,000 cell measurements were used to construct each histogram. As a control, we expressed GFP from a constitutive promoter and observed continuous, rheostatic-like expression dynamics and a homogenous response in the population (Figure S1E). Strain genotypes and plasmid descriptions are provided in Tables 1 and 2 .

