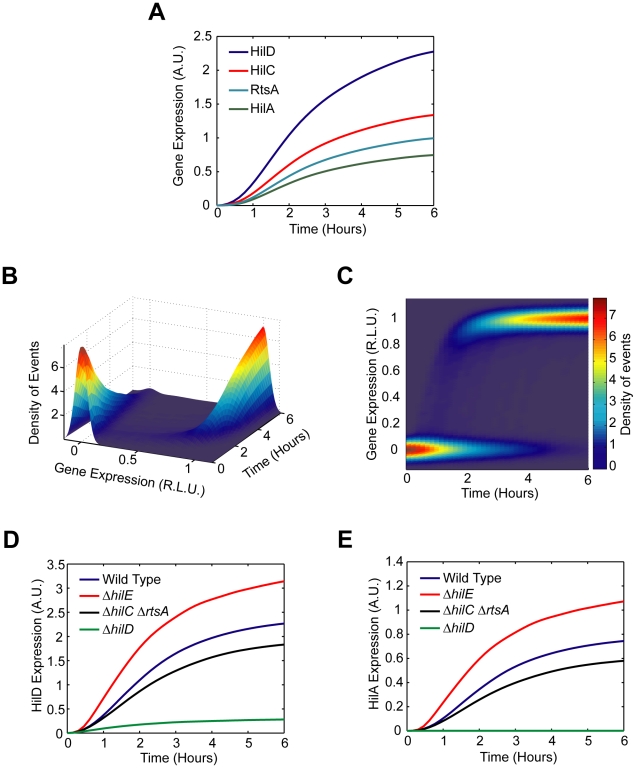
Figure 5. Mathematical model is able to accurately capture SPI1 gene expression dynamics both for wild type and key mutants.
(A) Time-course simulation of HilD, HilC, RtsA, and HilA expression dynamics in wild-type cells. These results are the average of 1000 simulations. These simulations are meant to capture the population-level behavior of the circuit. (B) Time-course simulation of HilA expression at single-cell resolution. The expression values are normalized to one and plotted on a log scale. The expression values are given in relative log units (R.L.U.). Similar expression dynamics are also seen for HilD, HilC, and RtsA (see Matlab code provided as supplementary material). (C) Same results provided as a two-dimension heat plot, where the color intensity denotes the density of events. Note that the model captures the transient heterogeneity observed in our flow cytometry data where cells in both the “off” and “on” states are found at intermediate times. Panels A–C were generated from the same set of simulation runs. (D and E) Time-course simulation of HilD (D) and HilA (E) expression dynamics in wild type and ΔhilD, ΔhilC ΔrtsA, and ΔhilE mutants at population resolution. The results for each mutant were obtained from the average of 1000 simulations. Similar behavior is also seen at single-cell resolution. Mutants were simulated by setting the activity of the respective gene to zero in the model. A detailed description of the model is provided in the Materials and Methods.

