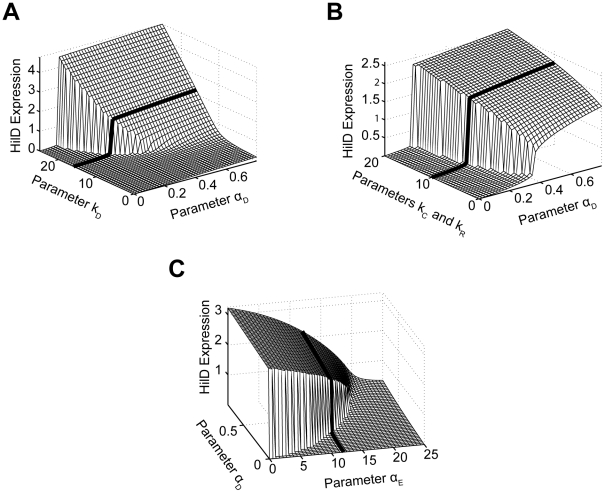
Figure 6. Parametric analysis of model predicts that SPI1 gene circuit functions as an amplifier and encodes an activation threshold.
(A) Effect of positive feedback on HilD expression. Plot shows steady-state concentration of HilD as a function of the parameters  and
and  . The parameter
  specifies the degree by which the SPI1 regulators - HilC, HilD, and RtsA - can activate HilD expression, effectively the strength of positive feedback on HilD expression. The parameter
  specifies the strength of the signal activating HilD expression. (B) Effect of HilC and RtsA on HilD expression. Plot shows the steady-state concentration of HilD as a function of the parameters
  ,
,  , and
, and  . The parameters
  and
and  specify the degree by which the SPI1 regulators - HilC, HilD, and RtsA - can activate HilC and RtsA expression, respectively. In other words, these parameters set the strength of feedback on HilC and RtsA expression. In these simulations, the parameters
  and
and  were both varied in tandem: the numerical values for the two are the same. (C) Effect of HilE on HilD expression. Plot shows the steady-state concentration of HilD as a function of the parameters
  and
and  . The parameter
  specifies the rate of HilE expression. Results for HilA are shown in Figures S6A–C. The black lines in the plots are used to denote the results obtained using the nominal parameters (aside from
  ). A detailed description of the model is provided in the Materials and Methods.

