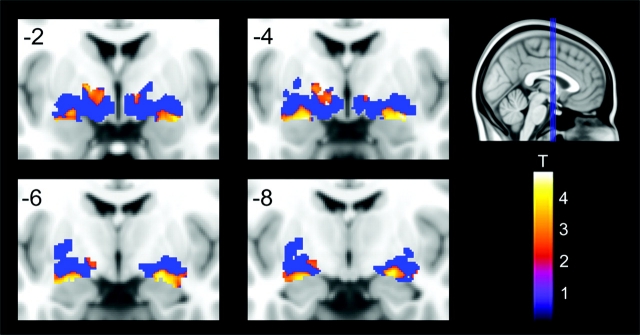
Figure 2.
Bilateral volume reductions of BF in MCI patients compared with healthy elderly subjects, no age corrections (P < 0.01, uncorrected). Coronal slices are from anterior to posterior (y = −2 to y = −8) in intervals of 2 mm. Blue area represents the combined probability maps (Ch1−Ch2, Ch3 = HDB, Ch4, and Ch4p) in MNI space including all voxels showing any probability of belonging to a cholinergic nucleus (BF ROI). Significant volume reductions are coded by the color scale (significance levels represented by T-values).

