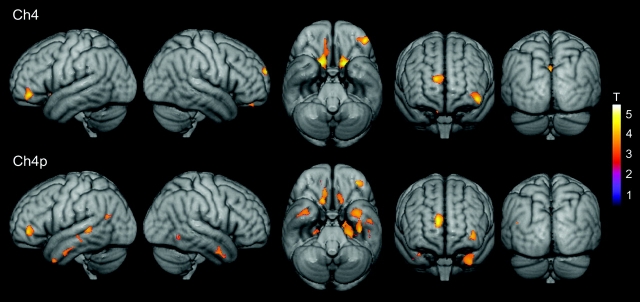
Figure 4.
Changes in the volume of Ch4 (top panel) and Ch4p (bottom panel) associated with reductions in regional gray matter concentration in MCI patients. Statistical threshold was set at P < 0.005, uncorrected, and cluster extension was set at 50 contiguous voxel as minimum. Significant correlations are coded by the color scale (significance levels represented by T-values).

