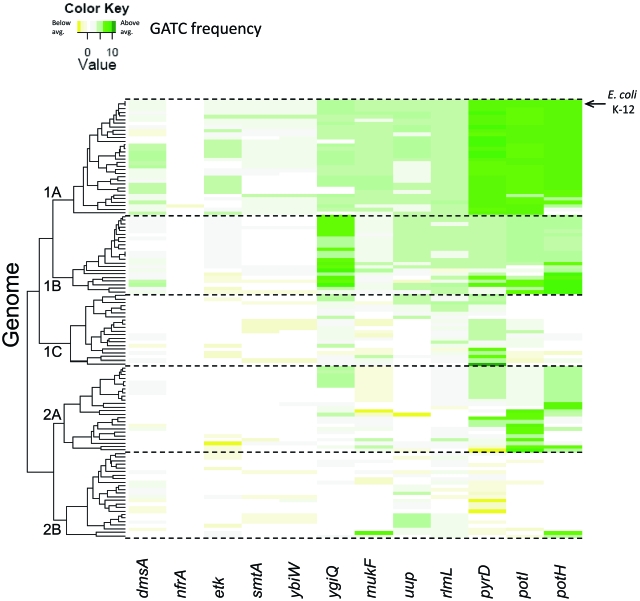
FIG 7 .
Conservation of GATC motifs in SeqA binding targets. The figure shows a heat map describing the GATC motif contents of 123 bacterial genomes containing a seqA homologue (rows) and a group of genes bound by SeqA in our ChIP-chip analysis (columns). Genes that have a higher frequency of GATC motifs than the genome background are green, and genes with an average or less-than-average GATC motif content are yellow. The genomes are clustered into evolutionary groups. Group 1A contains Enterobacteriaceae, such as E. coli and Shigella, and group 1B also contains Enterobacteriaceae, including Salmonella and Klebsiella. Group 2B contains other gammaproteobacteria, such as Pasteurella multocida. A high-resolution version of this figure, complete with genome accession numbers, is available in the supplemental material (Fig. S3).

