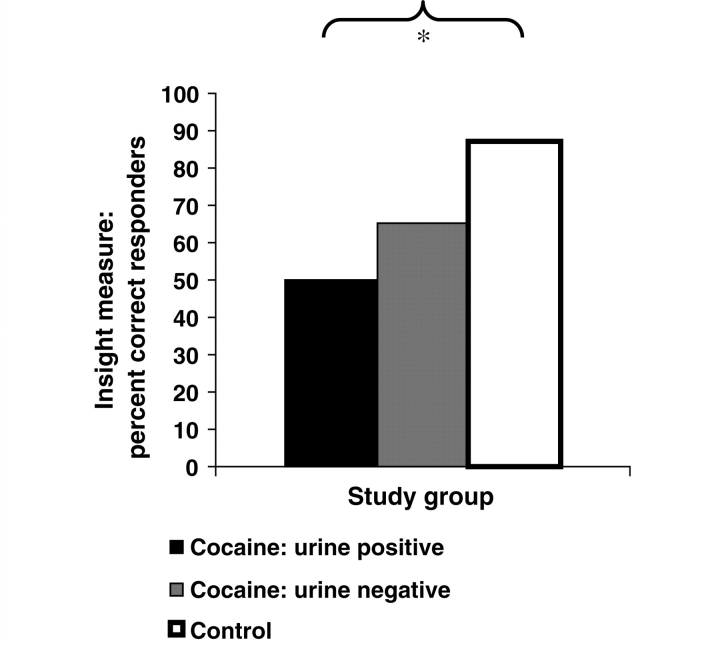
Figure 1.
Percentage of individuals displaying correspondence between their self-reported most selected picture category and their objectively most selected picture category (our measure of insight), for each study group. The significant comparison between urine positive cocaine subjects (n = 16) and healthy controls (n = 23) is flagged with an asterisk (P < 0.01). Urine negative cocaine subjects (n = 26) did not significantly differ from the other two study groups.

